
excel 業績比較
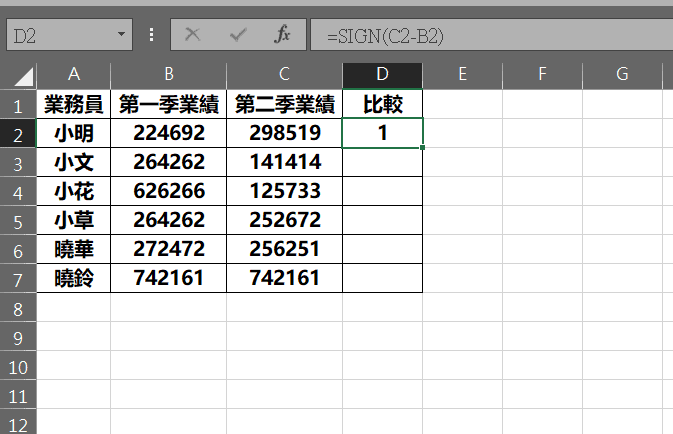
Step 1 使用SIGN函數,輸入公式「=SING(C2-B2)」,涵義為取兩個數值差,若為正數,則顯示「1」,若為負數,則顯示「-1」,若相等則顯示「0」
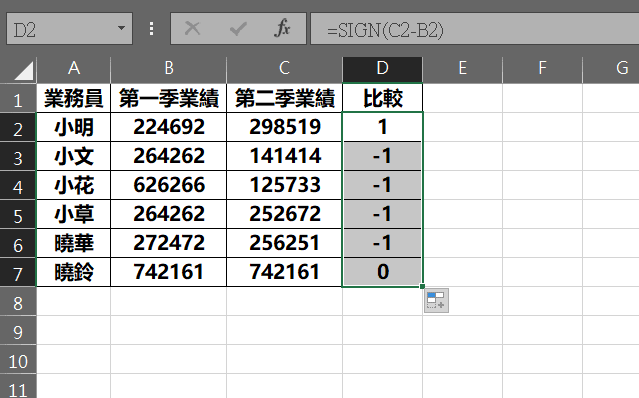
Step 2 將「比較」欄位填滿

Step 3 在工具列「常用」中選擇「條件式格式設定」,並選擇「新增規則」
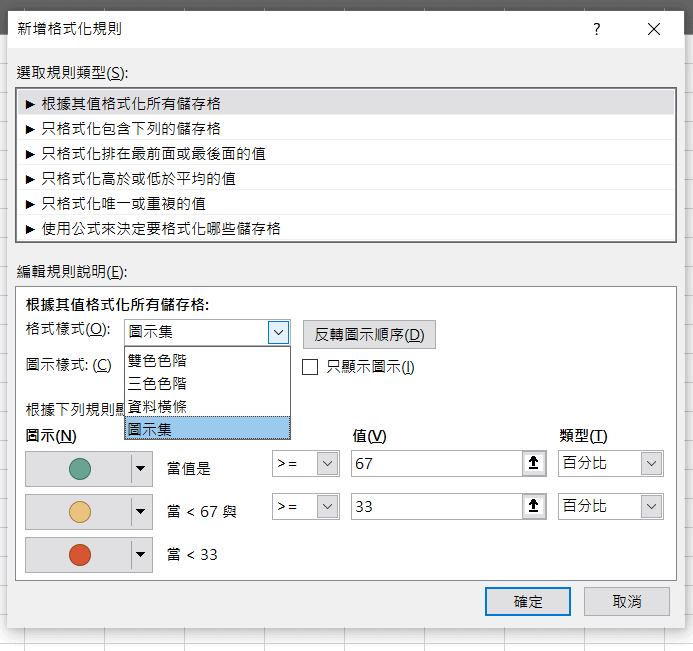
Step 4 選擇「圖示集」
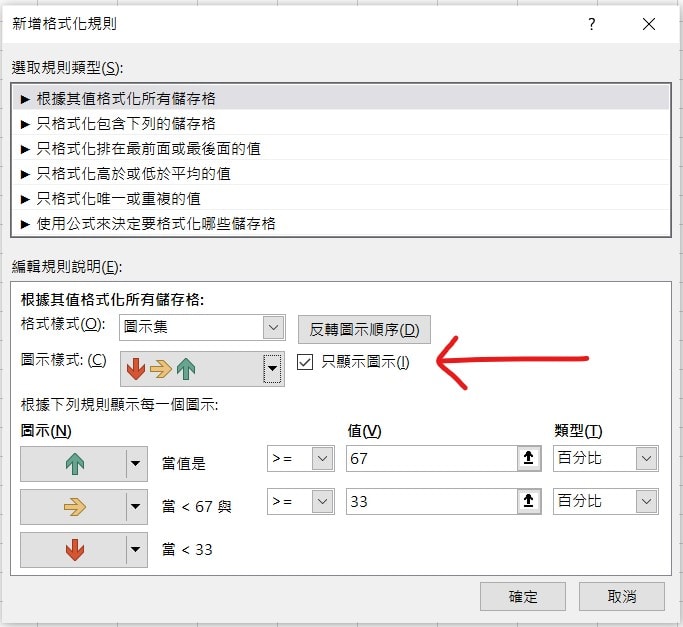
Step 5 更改「圖示樣式」,並將「只顯示圖示」打勾
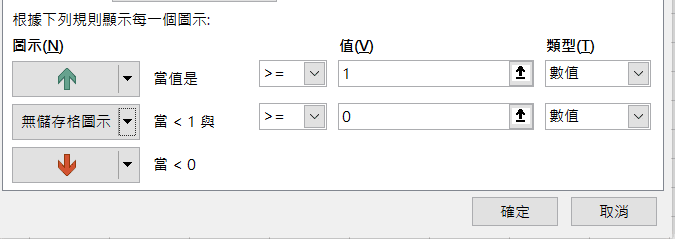
Step 6 將數值設定為上圖所示,也就是當等於1時,顯示↑,當小於0時,顯示↓,等於0時則不顯示
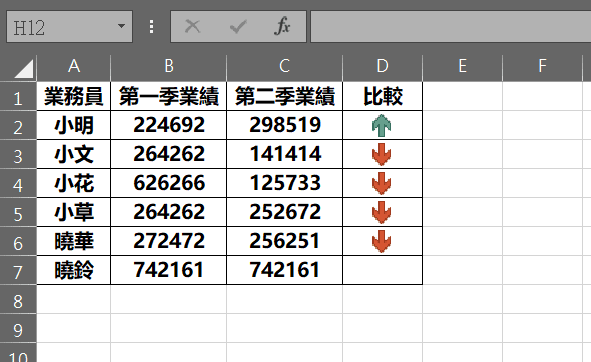
按下確定後,即可完成設定!
【教學】使用Excel公式比較業績資料並用圖示顯示?讓主管一目瞭然!