excel 占比圖
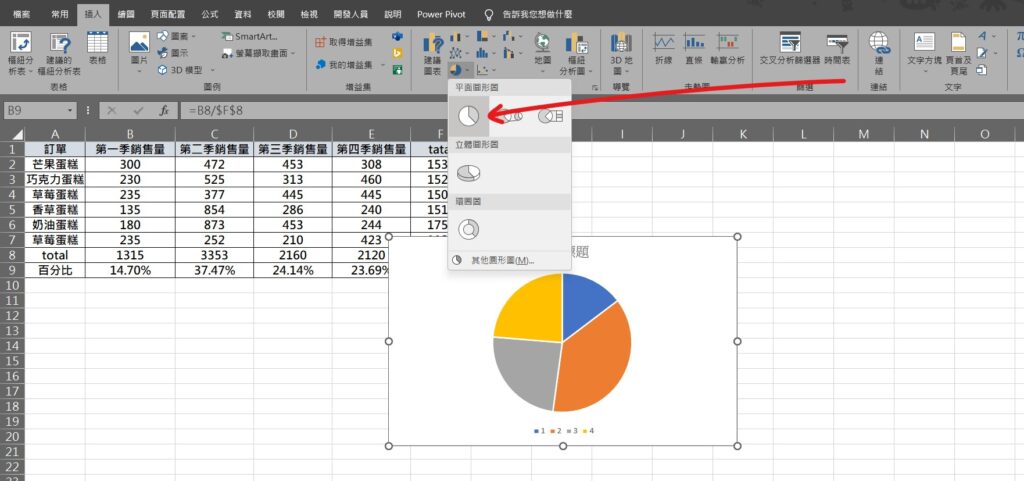
Step 1 在功能列「插入」中圖表選擇「插入圓形圖或環圈圖」內的「圓形圖」
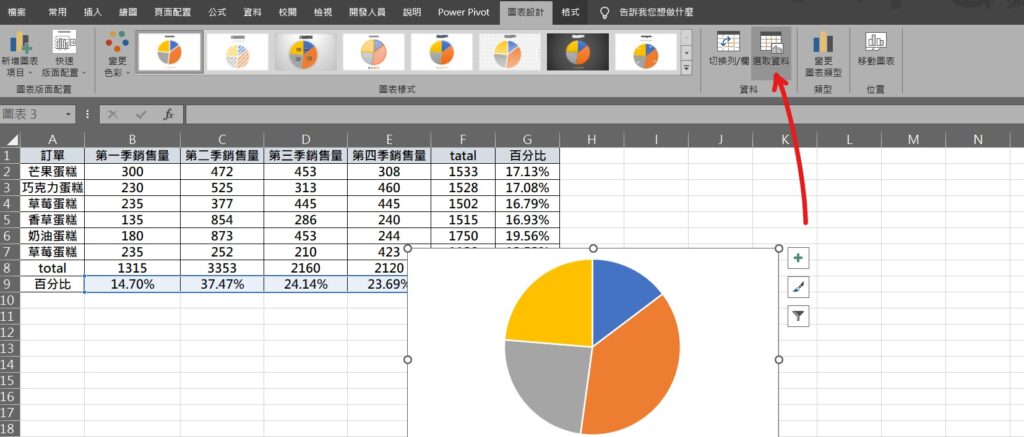
Step 2 在功能列「圖表設計」中資料選擇「選取資料」
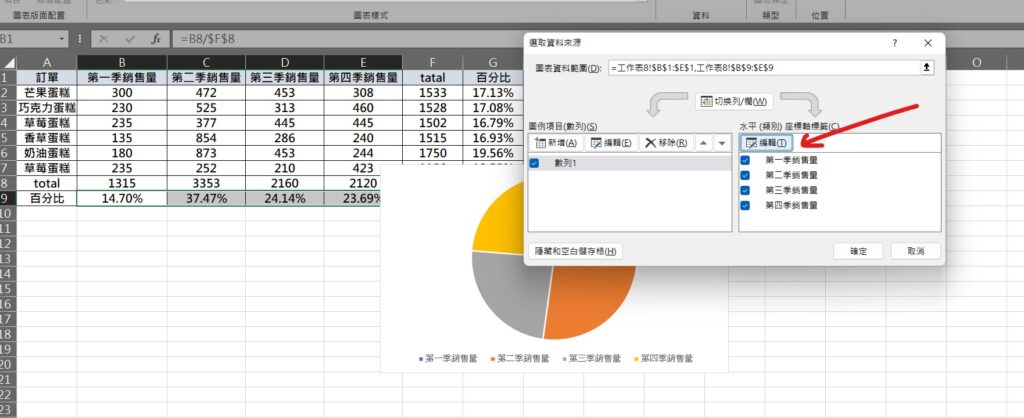
Step 3 在「水平(類別)座標軸標籤」選擇「編輯」,並選取水平座標軸類別名稱儲存格範圍
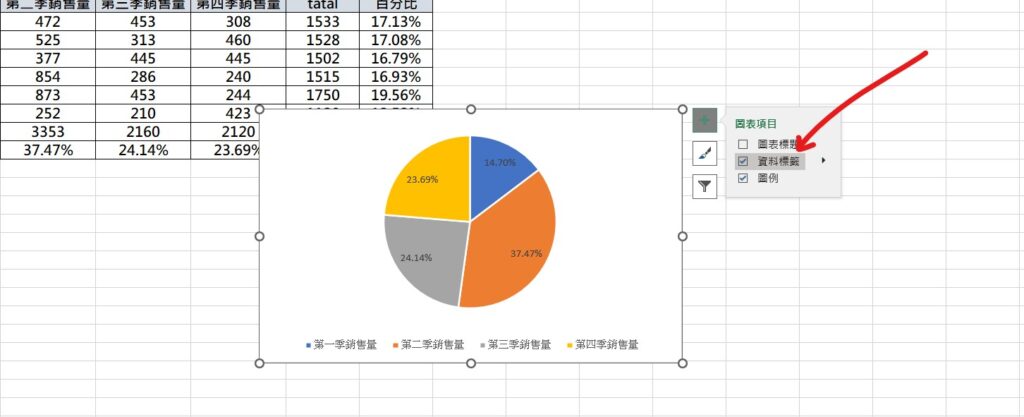
Step 4 在圖表右上方「圖表項目」選擇「資料標籤」勾選,即可顯示數據在圖表上
【教學】Excel 如何插入百分比占比圖表?超簡單馬上學會!
A blog of my life

excel 占比圖
Step 1 在功能列「插入」中圖表選擇「插入圓形圖或環圈圖」內的「圓形圖」
Step 2 在功能列「圖表設計」中資料選擇「選取資料」
Step 3 在「水平(類別)座標軸標籤」選擇「編輯」,並選取水平座標軸類別名稱儲存格範圍
Step 4 在圖表右上方「圖表項目」選擇「資料標籤」勾選,即可顯示數據在圖表上