excel 類別統計

Step 1 在功能列「資料」中排序與篩選選擇「進階」

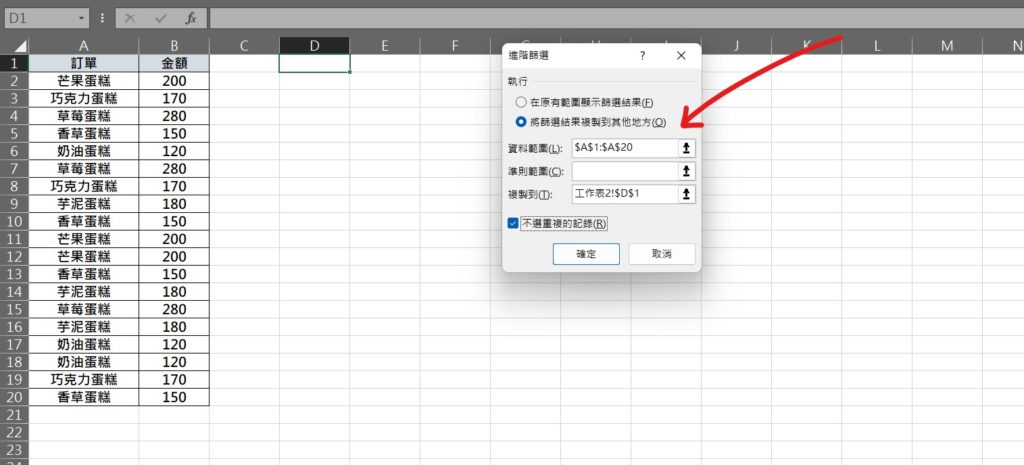
Step 2 選擇「將篩選結果複製到其他地方」,資料範圍選擇「訂單」所有範圍,包含標題,複製到空白儲存格中,並將「不選重複的紀錄」勾選

Step 3 將格式樣式調整完後,在總額中使用SUMIF函數將各類別進行統計,輸入公式「=SUMIF(搜尋範圍,搜尋標的,加總範圍)」,將範例代入「=SUMIF(訂單範圍,各類別儲存格,金額範圍)」
PS. 範圍須使用「$」固定,想知道「$」如何使用?請點我看文章

Step 4 將儲存格向下填滿,即可將各類別進行統計
【教學】Excel 如何將類別統計?一個公式馬上解決!
我成功套用在我的資料中了,謝謝教學!