excel 誤差值
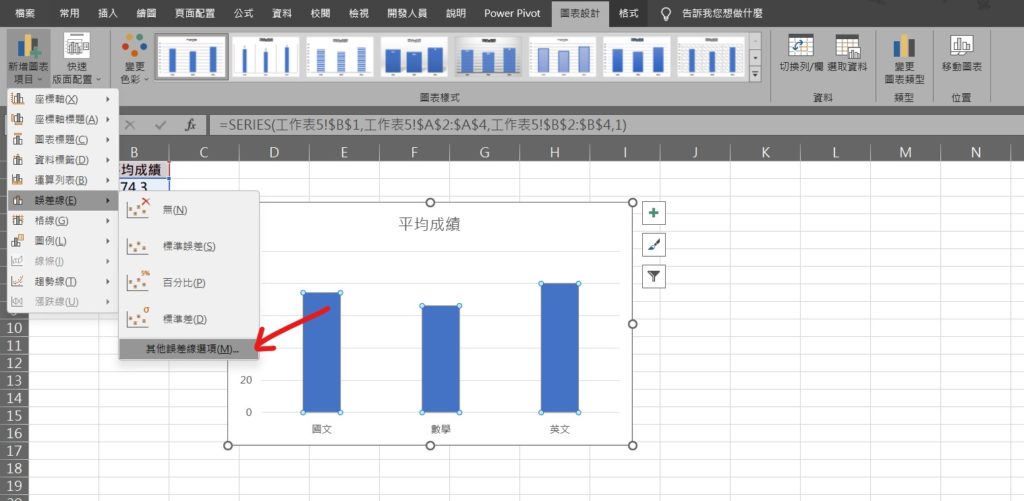
Step 1 點選圖表後,在功能列「圖表設計」中圖表版面配置選擇「新增圖表項目」內的「誤差線」,並選擇「其他誤差線選項」
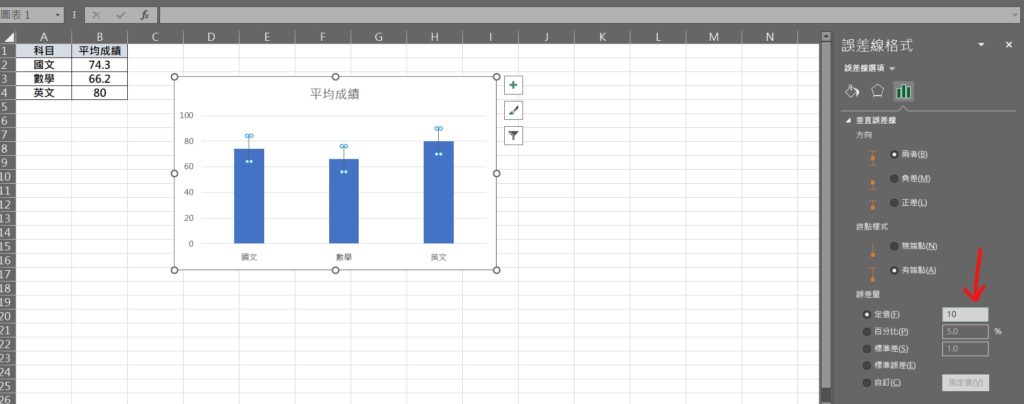
Step 2 在「定值」中可以自行調整誤差數值
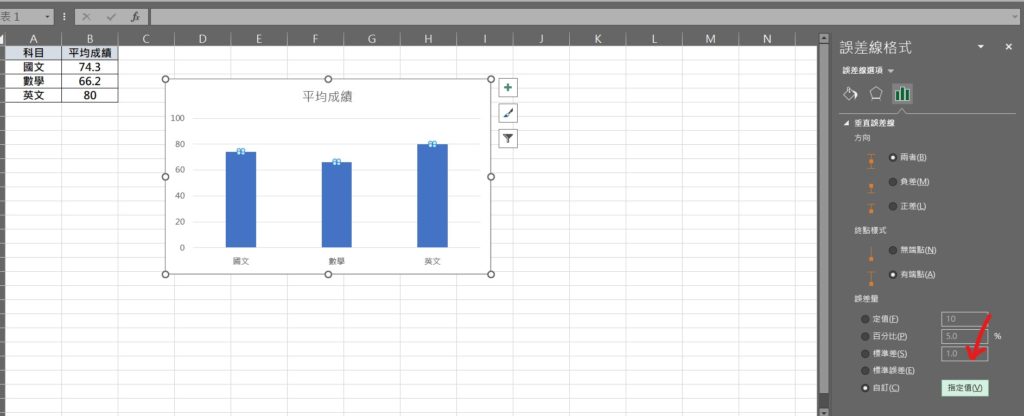
Step 3 也可以選擇「自訂」,並選擇「指定值」來自訂正負誤差值
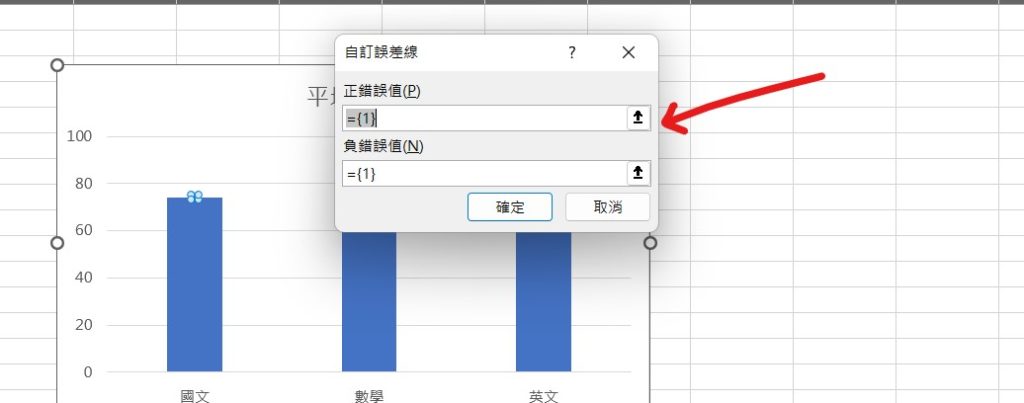
Step 4 分別輸入「正錯誤值」與「負錯誤值」的數值或儲存格位置,若為儲存格位置,前方須加上「=」
【教學】Excel 如何調整圖表誤差線的誤差值?自訂正負誤差值也可以!
A blog of my life

excel 誤差值
Step 1 點選圖表後,在功能列「圖表設計」中圖表版面配置選擇「新增圖表項目」內的「誤差線」,並選擇「其他誤差線選項」
Step 2 在「定值」中可以自行調整誤差數值
Step 3 也可以選擇「自訂」,並選擇「指定值」來自訂正負誤差值
Step 4 分別輸入「正錯誤值」與「負錯誤值」的數值或儲存格位置,若為儲存格位置,前方須加上「=」