
ppt 甘特圖
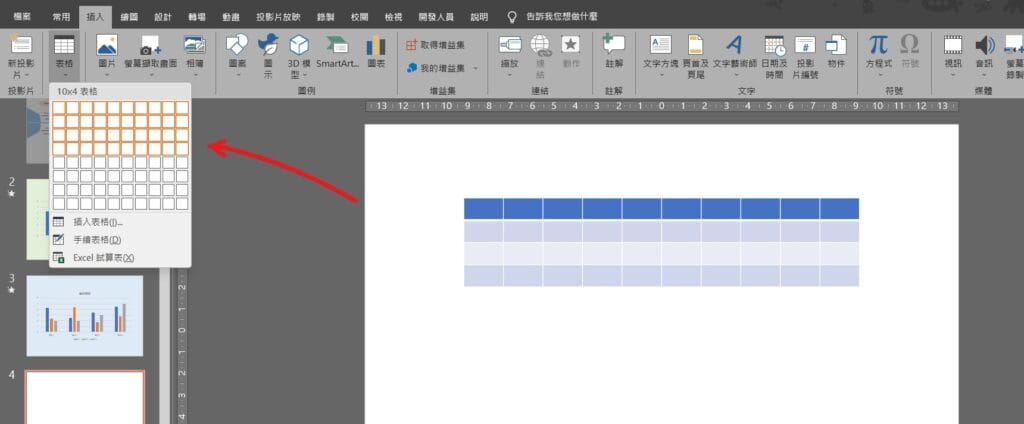
Step 1 在功能列「插入」中選擇「表格」,並選擇「欄」數與「列」數
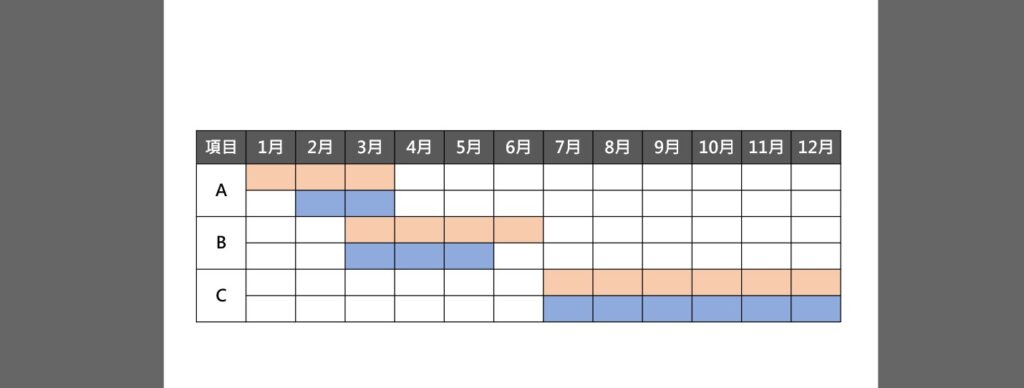
Step 2 輸入內容,將「預期時長」與「實際時長」分別用不同顏色填滿

Step 3 將表格選取,在功能列「表格設計」中表格樣式選擇「框線」內的「無框線」

Step 4 在功能列「表格設計」中表格樣式選擇「框線」內的「外框線」

Step 5 在功能列「插入」中圖例選擇「圖案」內的「矩形」並繪製,使用相同顏色填滿圖案

Step 6 在功能列「插入」中文字選擇「文字方塊」並繪製,輸入文字即可
【教學】PowerPoint 要怎麼做甘特圖?跟著步驟馬上搞定!
感謝分享!看上去好像比在 excel中創建要簡單一些