excel 樞紐分析
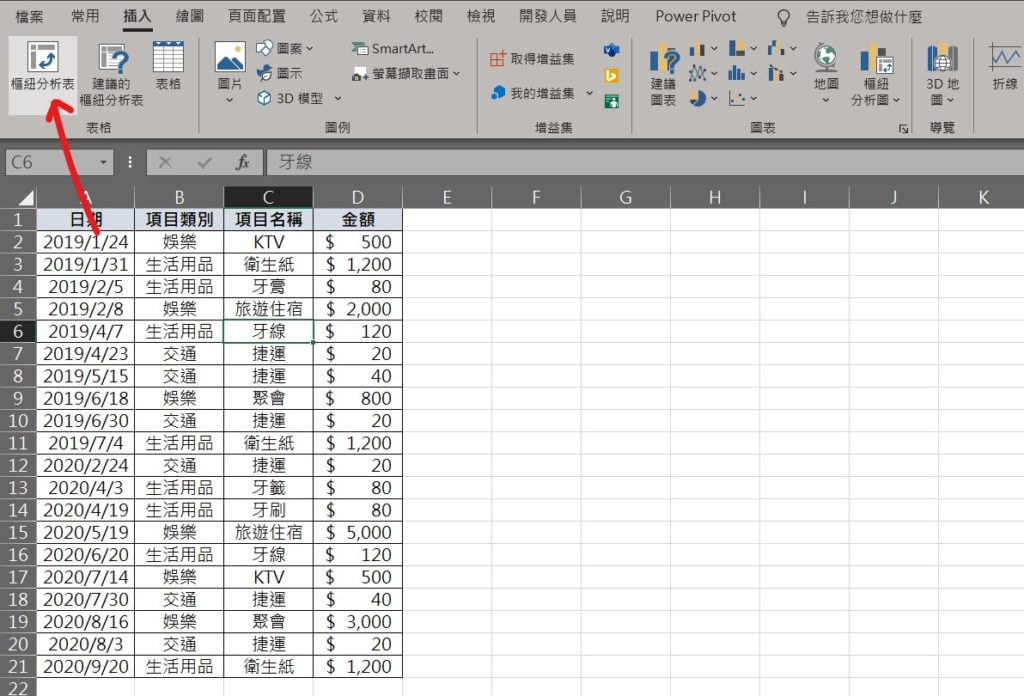
Step 1 在功能列「插入」中表格選擇「樞紐分析表」
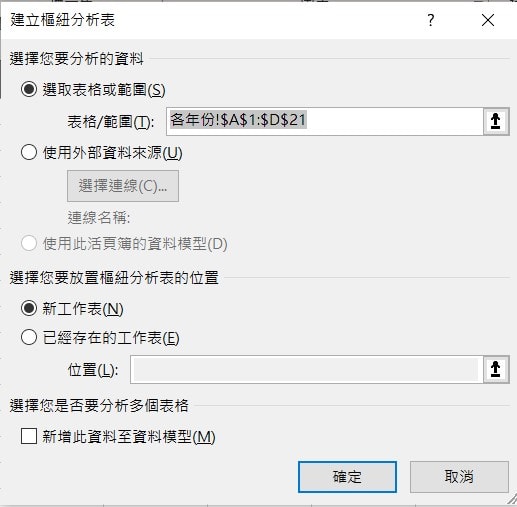
Step 2 確認選取表格或範圍的儲存格位置無誤
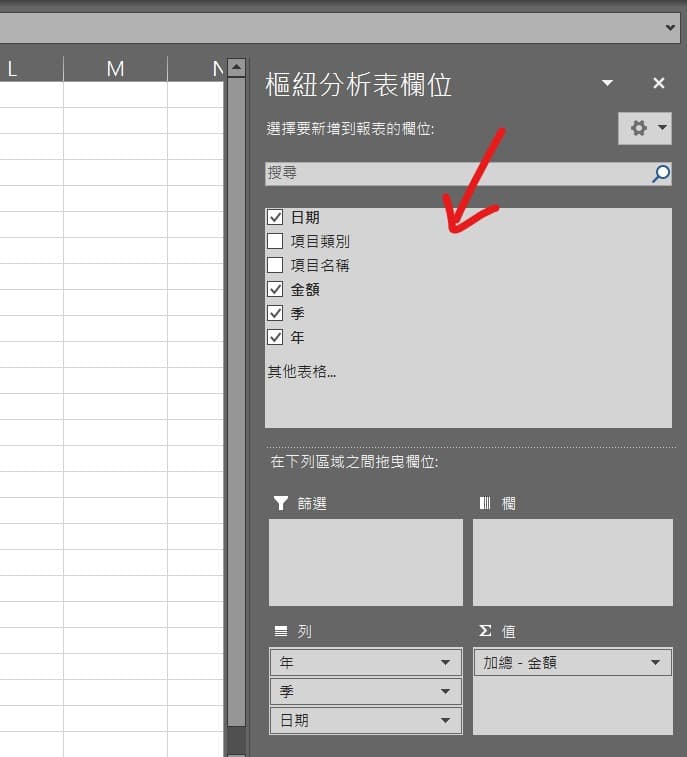
Step 3 在新工作表會開啟樞紐分析表欄位,將「日期」及「金額」欄為勾選
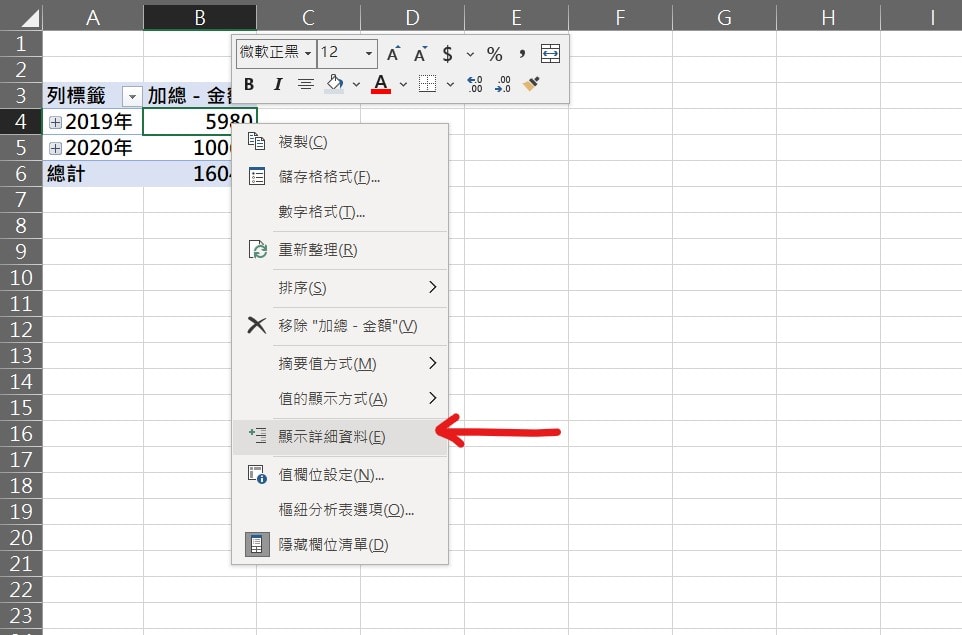
Step 4 在「2019年」的「金額」欄位按下滑鼠「右鍵」,選擇「顯示詳細資料」
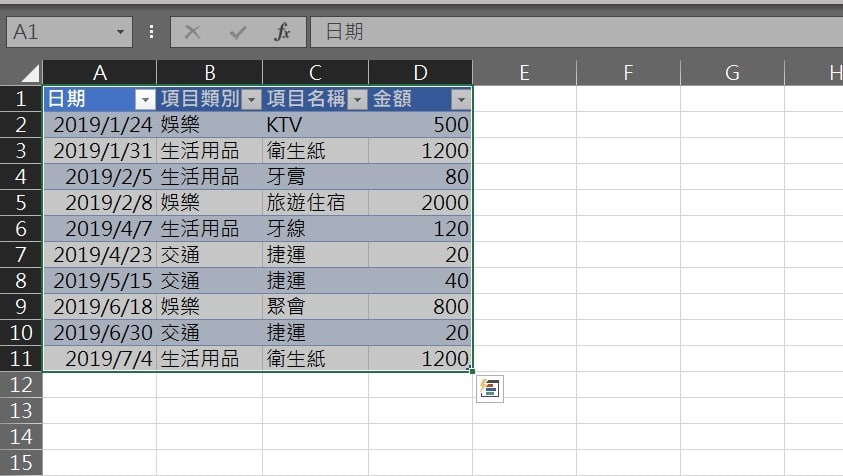
Step 5 會自動新增一個工作表,並將2019年的所有詳細資料顯示
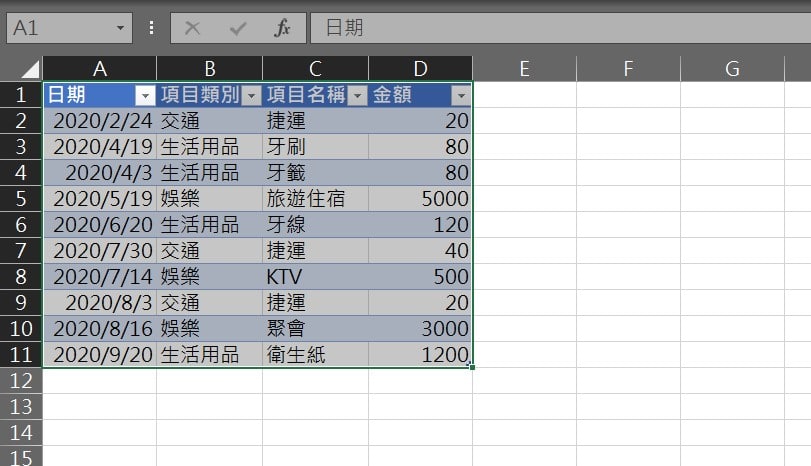
Step 6 其他年份只需重複Step 4 步驟,即可將各個年份區分成不同工作表
【教學】Excel 如何將資料依照年份個別分成不同工作表?
A blog of my life

excel 樞紐分析
Step 1 在功能列「插入」中表格選擇「樞紐分析表」
Step 2 確認選取表格或範圍的儲存格位置無誤
Step 3 在新工作表會開啟樞紐分析表欄位,將「日期」及「金額」欄為勾選
Step 4 在「2019年」的「金額」欄位按下滑鼠「右鍵」,選擇「顯示詳細資料」
Step 5 會自動新增一個工作表,並將2019年的所有詳細資料顯示
Step 6 其他年份只需重複Step 4 步驟,即可將各個年份區分成不同工作表